


The short answer: In September 2026, Durham Region recorded 552 home sales (down 8.3% from August) and 1,834 new listings (up 28.9%), according to TRREB. The average price edged up 1.05% to $828,141, and homes sold in 30 days on average. TRREB’s MLS® HPI benchmark for Durham was down 5.2% year over year.
September kicks off the fall market, and this year more Durham homeowners listed while buyers took their time. Here’s what Toronto Regional Real Estate Board (TRREB) numbers show, with Toronto and York for GTA context.
Durham Region real estate market update: September 2026
| Durham Region | August 2026 | September 2026 | Change |
|---|---|---|---|
| New listings | 1,423 | 1,834 | +28.9% |
| Home sales | 602 | 552 | −8.3% |
| Average price | $819,569 | $828,141 | +1.05% |
| Average days on market | 31 | 30 | −1 day |
Source: TRREB Market Watch, September and August 2026, all home types; August figures as first reported. Actual figures, not seasonally adjusted.
More new listings and fewer sales gave Durham buyers more choice in September. Part of the jump in listings is the usual fall pattern, as sellers return after the summer. On a seasonally adjusted basis, TRREB says GTA-wide sales and new listings were both down from August.
Prices were steady month over month. The average Durham price rose 1.05% from August, and homes sold a day faster. Over the year, prices are still lower: TRREB’s MLS® HPI composite benchmark for Durham was $805,600 in September, down 5.2% from September 2025. In our experience, well-prepared, well-priced homes in Pickering, Ajax, Whitby and Oshawa are still drawing serious buyers.
Durham home prices by home type
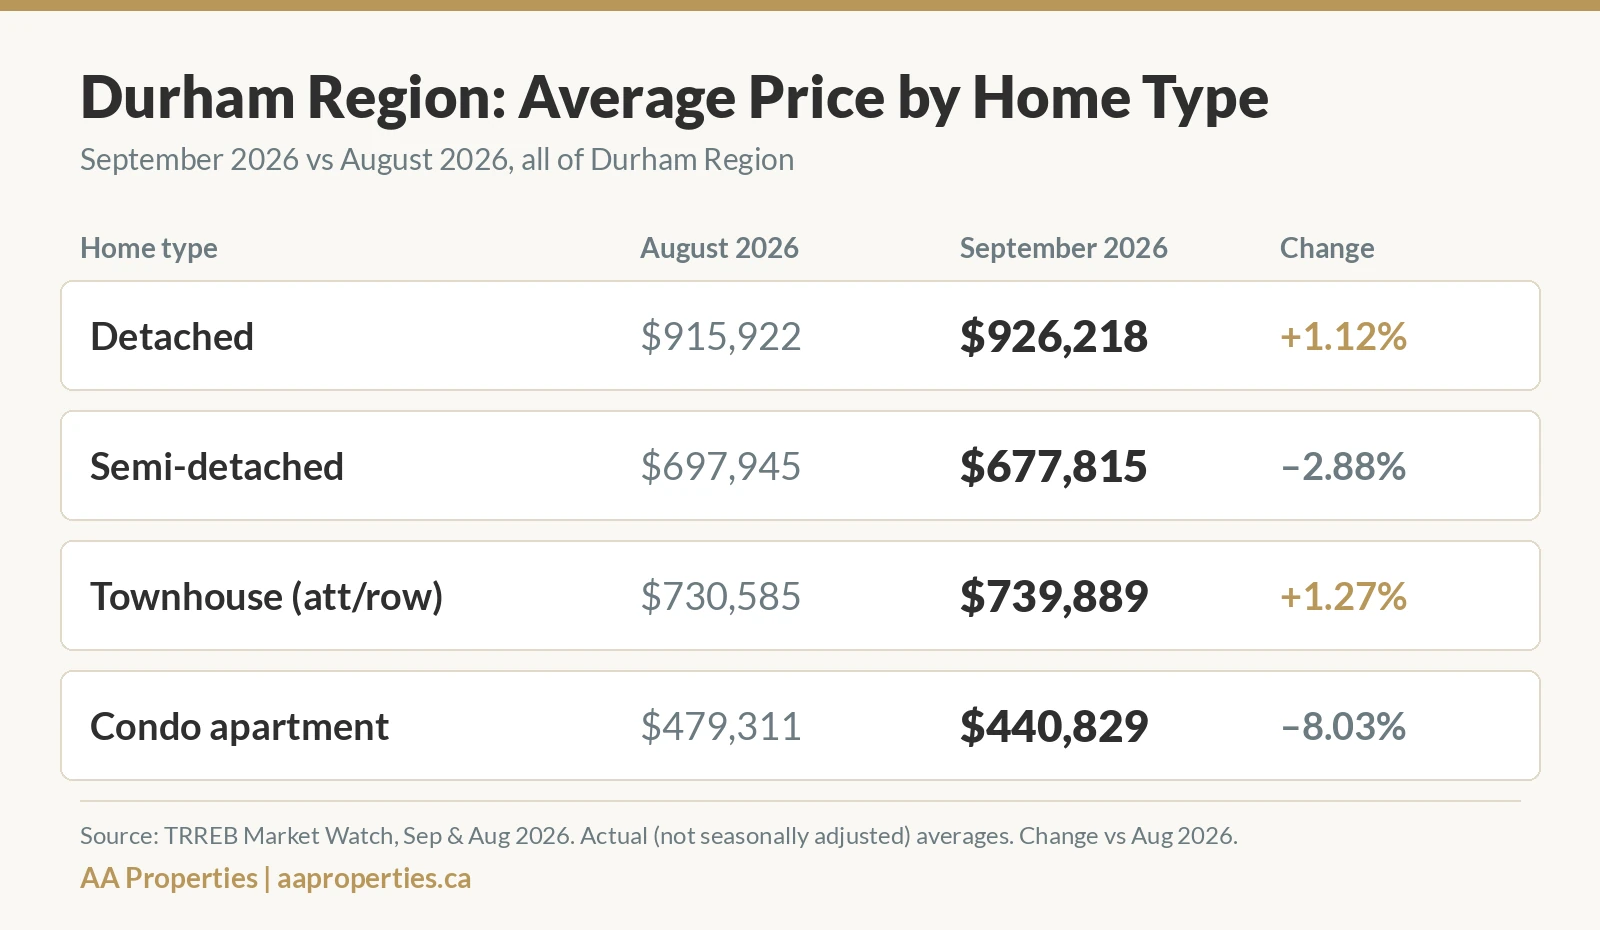
Detached homes averaged $926,218 in September (up 1.12%), and freehold (att/row) townhouses averaged $739,889 (up 1.27%). Semi-detached homes averaged $677,815 (down 2.88%), and condo apartments averaged $440,829 (down 8.03%).
Durham records relatively few semi-detached and condo apartment sales (27 and 38 in September), so those averages can swing with the mix of homes that sold. Curious about your own street? Find out what your neighbour sold for.
Toronto and York Region: the wider GTA picture
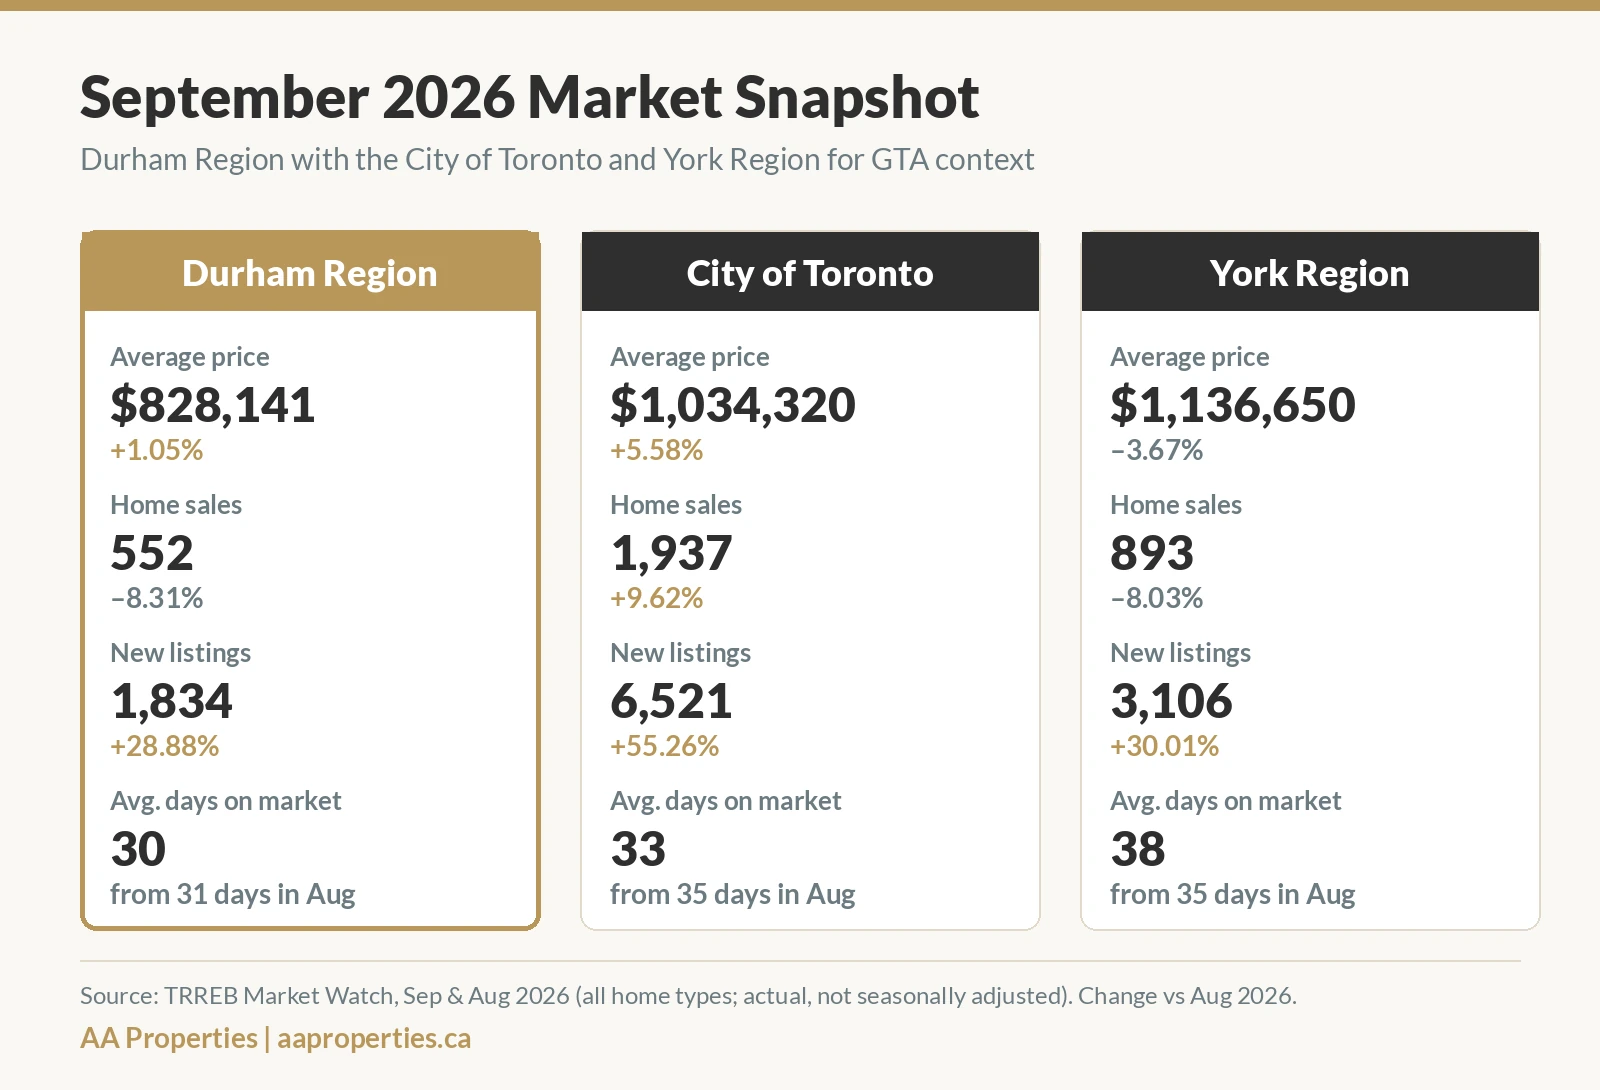
In the City of Toronto, sales rose 9.62% to 1,937 while new listings jumped 55.26% to 6,521. The average price climbed 5.58% to $1,034,320, and days on market dipped from 35 to 33.
York Region moved more like Durham. Sales eased 8.03% to 893, new listings rose 30.01% to 3,106, and the average price slipped 3.67% to $1,136,650. Homes took 38 days to sell on average, up from 35.
Durham’s average price was about $206,000 below Toronto’s and about $308,500 below York’s. That gap is one reason we keep meeting families moving east to Pickering and Ajax.
What September means for buyers and sellers
Buyers: More listings and a steadier pace can mean more choice and more time to compare. Get pre-approved, set up listing alerts, and book a buyer’s consultation so you’re ready when the right home appears.
Sellers: With more homes competing for attention, pricing and presentation matter more. Start with a free home evaluation, and see what selling will cost in our guide to seller closing costs in Ontario.
Looking ahead to the rest of the fall
TRREB’s Chief Information Officer, Jason Mercer, says there is substantial pent-up demand in the GTA, with many households intending to buy in the months ahead. He adds that they need confidence their jobs are secure and that inflation won’t push up borrowing costs. We’ll share what we see next month.
Who we help: AA Properties focuses on Durham Region (Pickering, Ajax, Whitby, Oshawa and beyond) and also serves the GTA, including Toronto and York Region.
Ready to see your own numbers?
Averages are a starting point. Your home and your street are what count.
Or contact us, call or text 416-845-8433, or email alex@aaproperties.ca.
Frequently asked questions
What happened in the Durham real estate market in September 2026?
According to TRREB, Durham Region had 552 home sales, down 8.3% from August, and 1,834 new listings, up 28.9%. The average price rose 1.05% to $828,141, while TRREB’s HPI benchmark was down 5.2% year over year.
What was the average home price in Durham Region in September 2026?
It was $828,141 for all home types, according to TRREB. Detached homes averaged $926,218, freehold townhouses $739,889, semi-detached homes $677,815 and condo apartments $440,829.
Is Durham Region cheaper than Toronto and York Region?
On average, yes. In September 2026, Durham’s average price of $828,141 was about $206,000 below the City of Toronto ($1,034,320) and about $308,500 below York Region ($1,136,650), based on TRREB data.
Why did new listings jump in September?
New listings usually rise in September as sellers return after the summer. TRREB reports that on a seasonally adjusted basis, which removes those calendar swings, GTA-wide sales and new listings were both down from August 2026.
Alex Antsyferov is a Broker and the founder of AA Properties, Crown Kingdom Realty Inc., Brokerage. General information only, not a forecast or an appraisal.
The information in this blog is deemed accurate but not guaranteed. It’s for general purposes only and isn’t legal, financial or tax advice.
Stay Up-To-Date With AA Properties
You’re more than a client to us, you’re a valued part of our inner circle. To get the most recent market news, see our latest listing, and get our newest blogs in your inbox each month, sign up to our newsletter.